Google Chart on VF Page
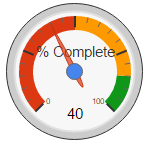 This blog explains how to add a google chart on a visualforce page. Please follow the below steps:
1. Download the Google Chart JavaScript and upload it as a Static resource.
2. Create a DIV element on your page and provide an ID.
<div id="chart_div" style="height: 130px;"></div>3. Now write the below code so that it executes on page load.
Load the Google Chart. This chart is “GUAGE” type. You can refer Google Chart Documentation for more types of charts.
google.charts.load('current', {'packages':['gauge']});
Call the “drawChart” method to create the chart.
google.charts.setOnLoadCallback(drawChart);
This method can be called when you want to draw the chart.
If you want to change the data then you can call this method again after
re-calculating the data.
function drawChart(){ var data = google.visualization.arrayToDataTable([ ['Label', 'Value'], ['% Complete', dataCompletionInt] ]);
var options = { width: 500, height: 150, redFrom:0, redTo:50, yellowFrom:50, yellowTo: 85, greenFrom: 85, greenTo: 100, minorTicks: 5};
Getting the element and drawing the chart on our page.
var chart = new google.visualization.Gauge(document.getElementById('chart_div'));chart.draw(data, options);
First published on Blogger in 2017. Some screenshots and APIs have changed since; the code is kept as written.